
SharePortals Charts are an easy way for solution administrators to graphical represent SharePortals data. Charts can be inserted anywhere on any configured Dashboard.
From your Homescreen or Dashboard navigate to Templates | Manage Charts:

This will take you to the list of existing Charts.
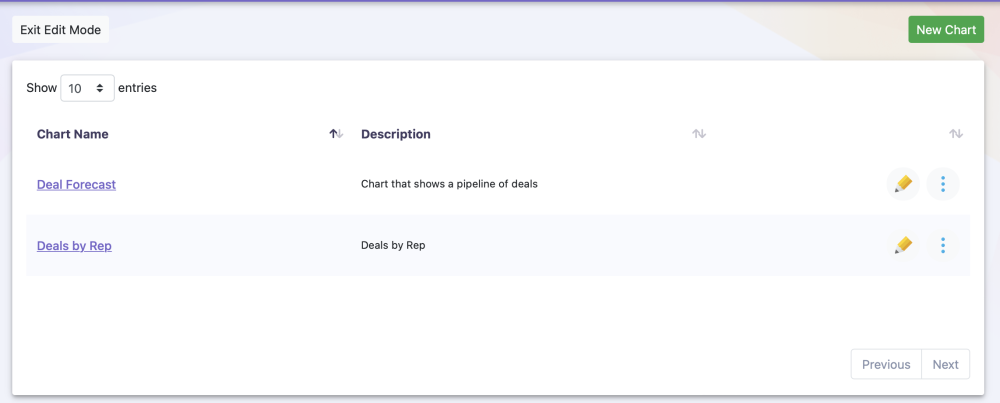
Select ‘New Chart’ at the top right of the list. This will open the New / Modify Chart modal. Once all the fields are completed the preview will show you what the chart will look like with current data as returned by the selected view.
The selected View will determine the available columns and filter applied to the data. Learn more about Views here.

Feedback
Copyright © 2024 Betasoft Limited
—
Powered by 
Post your comment on this topic.